What all information is on the Analytics Dashboard and Monthly Invoice Reports?
Please note that by clicking an image, it opens a light box and opens up a larger preview.
Current Month in Review

In the monthly review section, you can see your performance indicators for the current month. This includes the current date's listed nightly rate, current monthly occupancy percentage, and more. Here is a breakdown of each.
- Today's Listed Rate - This is the current day's listed rate.
- Average Nightly Booked Rate (This Month) - This is an average of actual booked nights divided by the count of days booked.
- Occupied Percentage - This is the current month's occupied percentage.
- Change in Revenue - This compares the current month's revenue to the previous month.
- Total Net Payout - This is an estimate of payouts that will arrive in your bank from reservations. This includes cleaning overages, commissions. This does not include invoiced expenses such as supplies and other categories.
- Current month reservations - The amount of reservations you currently have for the month.
- Days Booked this Month - The sum of days that are not available for booking because of booking and occupied statuses.
- Total Guests Hosted this Month - The total count of guests that have stayed at your property this month.
- Average Nightly Rate by Date - This chart showcases the average nightly rate for a particular booking by date. This is not the exact nightly rate as nights can have changes in pricing. This chart also includes average nightly rate trend lines and forecasting.
- Total Cleaning Fees - This is the current cleaning fees charged to guests.
- EBITDA - This is an estimate of EBITDA (Earnings before interest, depreciation, and amortization). This is an estimate and average based on mortgage and expenses you have filled out during onboarding. This number is constantly fluctuating depending on how early in the month it is. This is because no bookings have been completed and paid out earlier in the month.
Below Average Nightly Rate, is a table of the current month's summary. It depicts Reservation amount, Channel fees, transaction amount, base property rent, host payout, and expected arrival date of host payout.
Current Year in Review
In current year review, you get deeper analytics into annual performance. Here is a short description of each.
- Average Nightly Booked Rate - This is an average of actual booked nights divided by the count of days booked for the entire year.
- Expected Revenue - Based on quarterly filters, this shows current quarter actuals, compared to bookings submitted for next quarter stays. It's a simple forecast for the quarter to come and will usually be lower until more bookings come in as the next quarter approaches.
- Change in Revenue - This shows previous year's revenue against the current year's revenue.
- Current Year Reservations - This shows the total count of reservations booked to date for the current year.
- Estimated Economic Occupancy Percentage - The economic occupancy formula involves calculating the amount of rent collected from tenants and dividing it by the amount of rent that could be collected if all the tenants paid the full rental amount. This is based on estimates and the average nightly rate and if you were to be 100% booked and occupied. This data point allows better assessing of your property's success rather than physical occupancy.
- Estimated revenue left in current year - Based on days that are not booked, and by what the current date is, this is an estimation derived to show potential revenue left in the current year.
- Total Net Payout - This is an estimation of what arrives in your bank account after reservation transactions have completed, commissions, and cleaning overages.
- Days Booked this Year - This is a total count of days that are booked for all reservations for the current year.
- Acquisition Cap Rate - This indicates the rate of return that is estimated and expected for your property. This formula derives the percentage from your original purchase price of the property.
- Prevailing Market Cap Rate - This indicates the rate of return that is estimated and expected for your property. This formula derives the percentage from the most recent value of your property. As property values increase, this rate most likely will lower.
- Total Guests Hosted - The total count of guests that have stayed in your property for the current year.
- Total Cleaning Fees - This is the total cleaning fees that has been charged to guests for the current year.
- Similar to the monthly review summary, a table summary of the year is included as well. It includes the same data points such as base property rent, host payout estimations, expected payout arrival date, and channel fee.
Lifetime Performance
Generally, this is performance since signing up with Cohost. This includes multi-year data and forecasting.
Here are some definitions of each data point:
- Average Nightly Booked Rate - This is the average booked rate over the entire course of time with Cohost. This average will slowly change based on what is actually booked for your property.
- Total Revenue - The total revenue that your property has produced with Cohost.
- Total Cleaning Fees - The total amount of cleaning fees guests have paid.
- Total Net Payout - Estimated payout data that arrives in your bank account that includes cleaning overages, commission, and more.
- Lifetime Reservations - The total count of reservations while signed up with Cohost.
- Total Guests Hosted - The total count of guests that have stayed at your property.
- Host Payout by Check in Date - This is a breakdown of what your estimated payout is by date.
Home Value Insights
Home value insights is a collection of valuable data points that focuses more on your property value rather than STR and LTR performance.
Property Value Over Time
Our data points allow you to track your home value by date. These of course are estimates based on localized market data.
Home Value Changes, Equity Changes, and Lifetime Average Estimated Property Equity
Our equity calculations are based solely on the current estimated value of the home, the original purchase price, and the remaining of the two. On the right you will notice that Home Value and Equity Value changes are set by Day, Month, and Latest.
True Cap Rate & Geo Location
True Cap Rate is determined from both the Acquisition and Prevailing Cap rates. Geo location will let you drill down into the locations of your property(ies) as a fun widget showcasing your property locations and types. (Types include House, Apartment, Townhome, etc).
Short-Term Actuals vs Long-Term Rent Estimates
This chart shows localized estimates based on the current market for Long-term rentals, and what is actually being booked for your property. The blue "current estimated rent" is always changing based on our data points. They will always appear leveled and the same because of averages and formula calculations. This chart also forecasts future months as you can see towards the right side of the graph. This is based on bookings you currently have for future months, and may reflect lower differences because there is still time for bookings to occur for those months.
Analytical Insights
This section is more dedicated to graphs and charts for miscellaneous data points.
Total Guests Hosted by Month
This chart represents guests that have stayed at your property by month. Colors and stacked bars give you a total count, and breaks it down by adult, children, and infant count totals.
Pricing Dynamics
Pricing Dynamics Forecasting and Range provide you with insights to key seasonality and average nightly pricing forecasting. For this home, you can see in particular that December is a big month in the location of this property.
The pricing dynamics range shows both the Mode (Most Frequent Value) and the Averages.
Below the charts are data points for the average of these pricing dynamics by Month and Year.
Month to Month Booked Revenue & Payouts
This chart allows you to visualize payouts and revenue by month. Hovering over some of the data points will display totals for the month.
Booked Revenue by Year
This chart displays revenue by month. Each bar is a different color representing the year and monthly totals side by side. This is perfect for comparing multi-year performance.
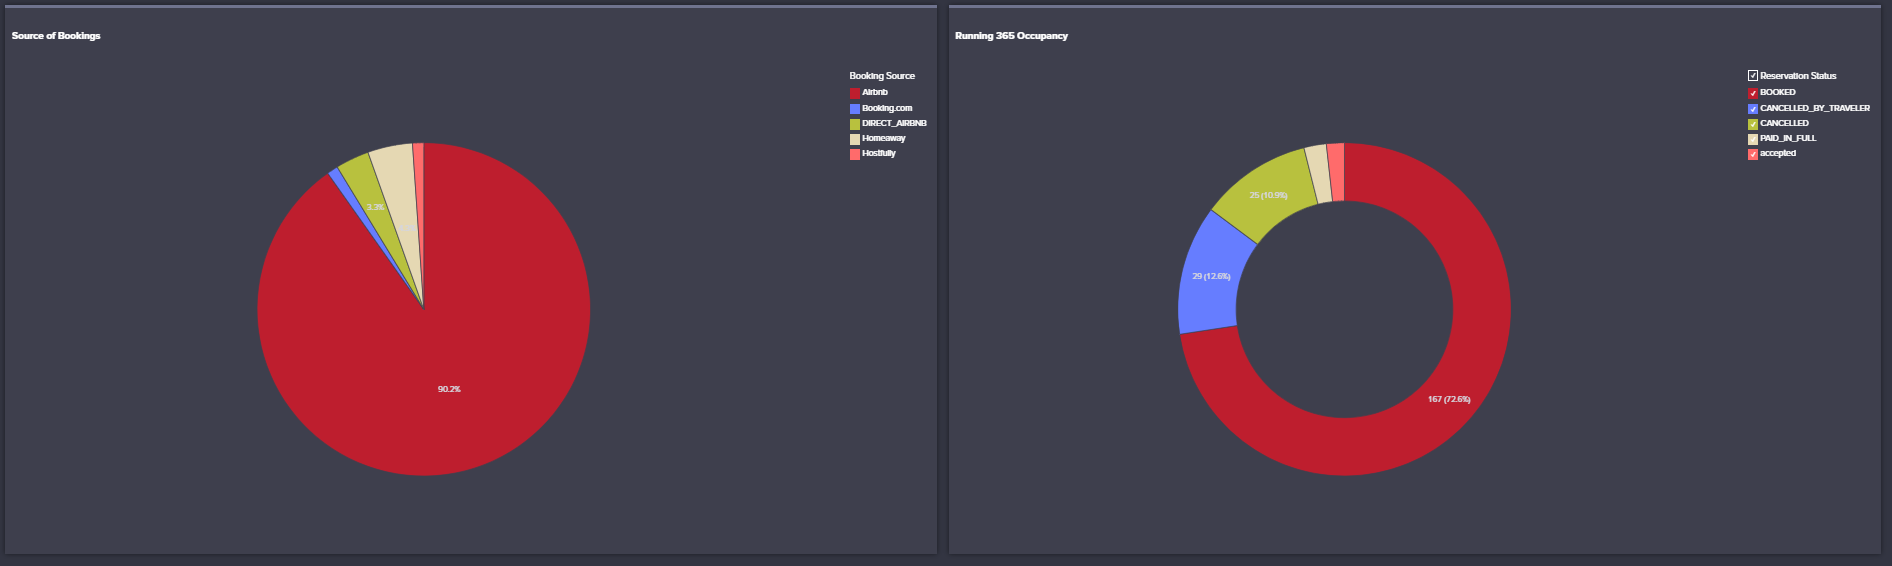
Source of Bookings & Statuses
This section is the final section and includes Source of bookings and a running 365 occupancy status count broken down by status names.
Source of Bookings - This is a summary of what listing channels are being utilized more for your specific property.
Running 365 Occupancy - This chart shows the status counts for the year. This can include booked statuses, cancelled-by-traveler, and other statuses. It's good to note that Booked, Paid in Full, and Accepted are all similar statuses but from different booking sources and channels.
Related Articles
When do I receive an invoice for cleanings?
Cleaning fees are passed to the customer and are paid in addition to the rental rate. Cleaners for your residence are paid by Cohost from those proceeds and will be reflected on the month end invoice sent to the property owner.Summit County Short-Term Rental Regulation Information
When deciding whether to let Cohost manage your short-term rental, it is important for you to understand the laws in your city. As a short-term rental property management company we do not provide legal advice, but we want to give you some useful ...Houston Short-Term Rental Regulation Information
When deciding whether to let Cohost manage your short-term rental, it is important for you to understand the laws in your city. As a short-term rental property management company we do not provide legal advice, but we want to give you some useful ...What kind of reporting will I be provided so I may understand my success?
Cohost will provide monthly and annual statements to the owner. We are always willing sit down and have a conversation on the results, as well as objectives for the future. You can also log into your Owner's Dashboard to track how well your property ...When do I get paid?
You will be paid within 10 days from month end for the previous month. This allows us to bundle your income into a monthly payment reducing fees to zero from constant transfers. For example, earnings from January will be distributed to you no later ...